Effects of Storage Mechanisms on Texture of French Fries
Characterizing Texture to understand the Effects of Storage Mechanisms
ABSTRACT
French fries are a popular potato product which are characterized by texture – in particular, by their crispness. The storage of French fries to prolong these texture characteristics over time presents an interesting design challenge which can be solved through a comparison of three major storage methods: free convection on all sides (wire rack), free convection on all but one side (open plate), and no convection (sealed box). A basis of Young’s modulus and maximum pressure before mechanical failure were selected as criteria to compare the storage methods. It was determined that there is no statistically significant difference between French fries kept in the three mechanisms in both properties. A subjective characterization of crispness was also performed using the same two criteria. Similarly, it was determined that there is no statistically significant difference in the characteristics of fries of two different crispness. Further work was suggested to be performed after increasing the sample size of the experiment.
Experimental Setup
Two experimental setups were used to measure the Young's modulus and the maximum pressure before failure of the french fries. The first is the four-point beam bending test setup which can be used to calculate the Young's modulus from the displacement of the center of the fry and force applied. The second is a crush test which can be used to determine maximum pressure before failure from the displacement of a pressure distribution plate placed over the fry and the force applied.
Crush Test
Four-Point Beam Bending Test
Results
Left: Graph of the average values of Young’s modulus and its corresponding uncertainties for all three storage mechanisms – wire rack, open plate, and sealed box. Fries on wire rack had a Young’s modulus of 1.17 ± 0.60 kPa, fries on the open plate had a modulus of 0.82 ± 0.32 kPa, and those in the sealed box had a modulus of 1.13 ± 0.50 kPa. Right: Graph of the average value of maximum pressure and the corresponding uncertainties for the three storage mechanisms. French fries subjected to the wire rack had a maximum pressure of 1555 ± 920 µPa, fries on the open plate had a maximum pressure of 3800 ± 1500 µPa, and those in the sealed box had a maximum pressure of 3200 ± 2100 µPa.
These two graphs summarize the results of the Young's modulus and maximum pressure before failure of 10 samples in each of the three categories. Although it may appear that there is a statistically significant difference between the wire rack and the open plate in maximum pressure, there unfortunately is not one when a two-sample assuming unequal variances t-Test was performed on the data. Furthermore, the difference in both the Young’s modulus and the maximum pressure for all three storage mechanisms is statistically insignificant as determined by an application of the same t-Test on the sets of data.
These statically insignificant differences in the metrics for the storage mechanisms may be due to many factors. The sample size of ten French fries per test may have been too small to reduce the uncertainty inherent to a small sample size. It is also possible that the apparatuses and sensors were not sensitive enough to produce a measurement accurate enough to result in a significant difference. Finally, it is possible that there is a large variation in composition of the potatoes the fries were cut from which could have propagated throughout the experiment.
Subjective Characterization of Crispness
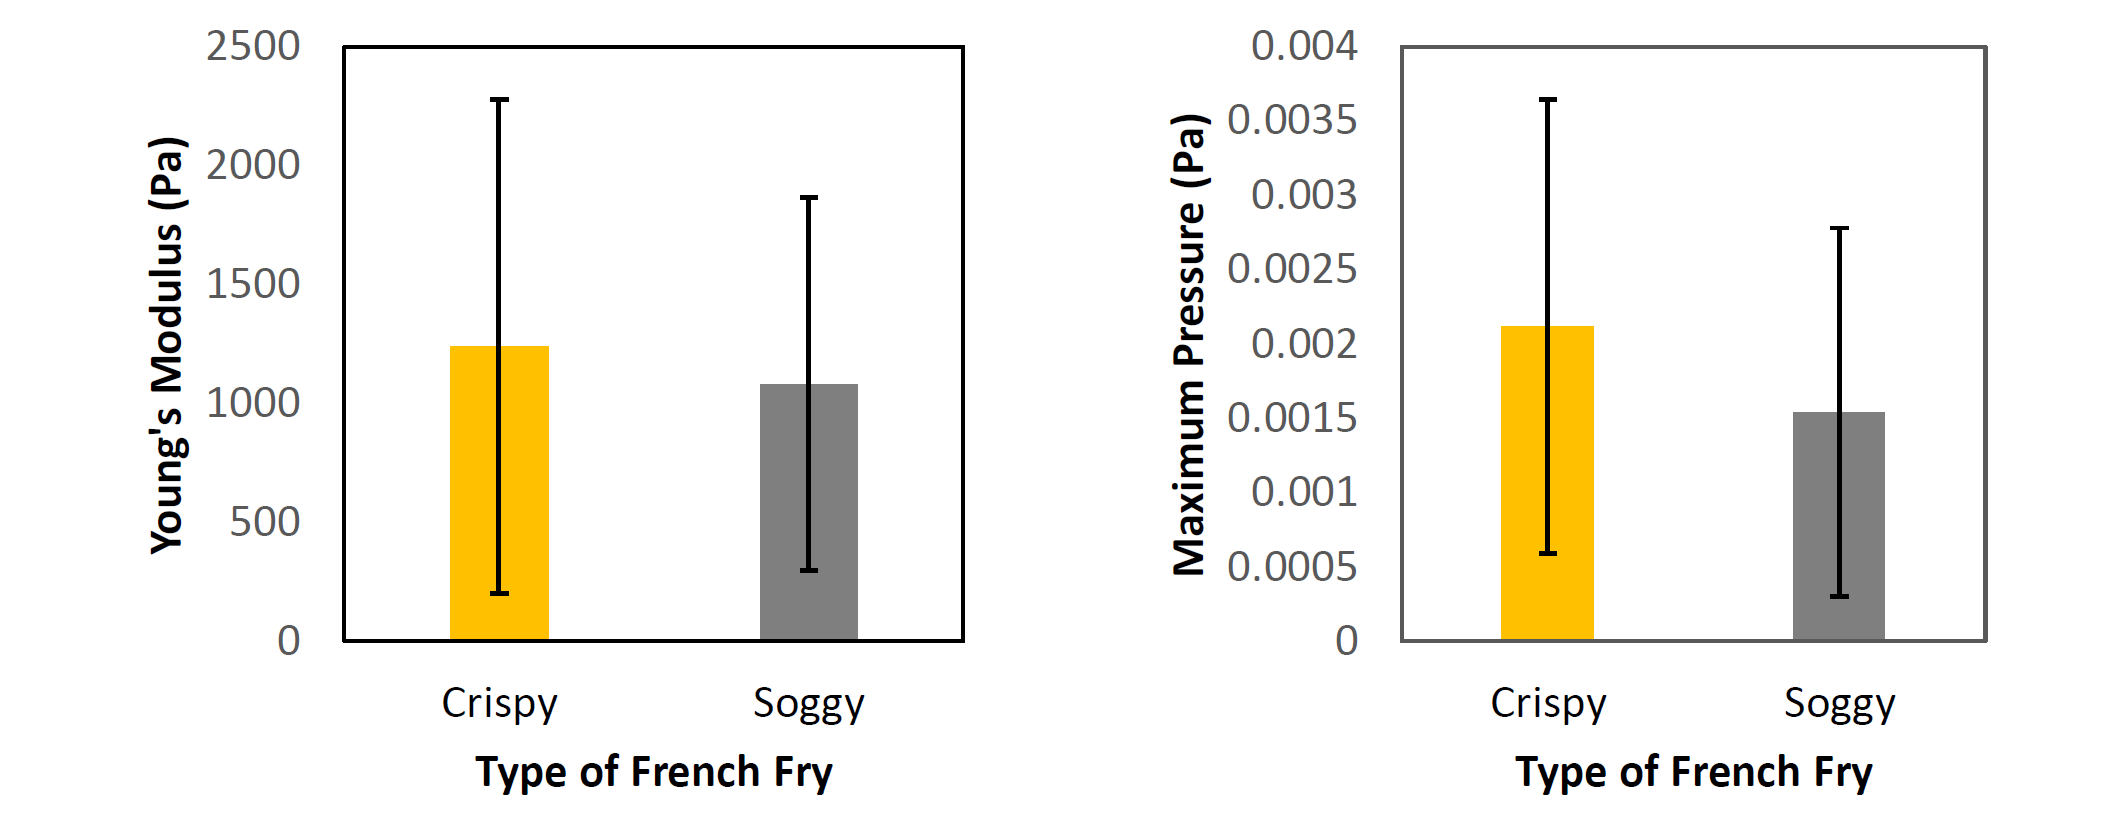
Left: Graph of the average values of Young’s modulus and its corresponding uncertainties for two textures of fries – crispy and soggy. Crispy fries had a Young’s modulus of 1.2 ± 1.0 kPa and soggy fries had a modulus of 1.08 ± 0.85 kPa. Right: Graph of the average value of maximum pressure and the corresponding uncertainties for the two textures. Crispy fries had a maximum pressure of 2.1 ± 1.2 mPa while soggy fries had a maximum pressure of 1.5 ± 1.3 mPa.
These two graphs summarize the results of the Young's modulus and maximum pressure before failure of 10 samples of each category. Once again, a two-sample assuming unequal variances t-Test was performed to determine if there was a statistically significant difference in the Young’s modulus of the two types of samples. The t-Test proved that within a 95% confidence interval, the Young’s modulus and maximum pressure for the two types of fries were statistically indistinguishable. In other words, from measuring just the Young’s modulus and maximum pressure of fries of varying crispness, the crispness of the fry cannot be distinguished.
This result may be due to the large amount of noise in each measurement due to the human application of force. It may also be possible that the Young’s modulus and the maximum pressure of the crisp French fry and the soggy French fry are almost the same. Since the Young’s modulus is within the magnitude of the value reported by other researchers, it is possible that by increasing the sample size, a statically significant difference may appear between the two types of French fries.
Future Work
To decrease the uncertainty in the work, it is necessary to increase the accuracy of the experiment and reduce the noise. Increasing accuracy of measurement of mass of French Fries, upgrading experimental setup for use with an INSTRON machine, increasing the sample size of each portion of the experiment and reducing possible dependency on potato parameters by selecting fries from a single potato to undergo all of the tests are all possible ways to further refine these results.
The full paper can be found here.
Under the guidance of Professor Ashin Modak for 2.671 Measurement and Instrumentation in Fall of 2015.


